Indicators
Indicators transform price, volume, or related series into values you can display on a chart or use in a condition.
Investfly includes trend, momentum, volatility, volume, and session-aware indicators such as SMA, EMA, RSI, MACD, ATR, VWAP, and Opening Range tools. The product picker is the complete current catalog.
Where indicators are used
- Charts: overlay or panel studies for visual research.
- Screeners: current-value criteria or result columns.
- Market Automations: a value inside the false-to-true trigger expression.
- Configuration-driven strategies: entry and exit expressions evaluated in live, virtual, or supported backtest contexts.
An indicator's availability can vary by asset, interval, data history, and host workflow.
Configure an indicator
- Select the indicator from the picker.
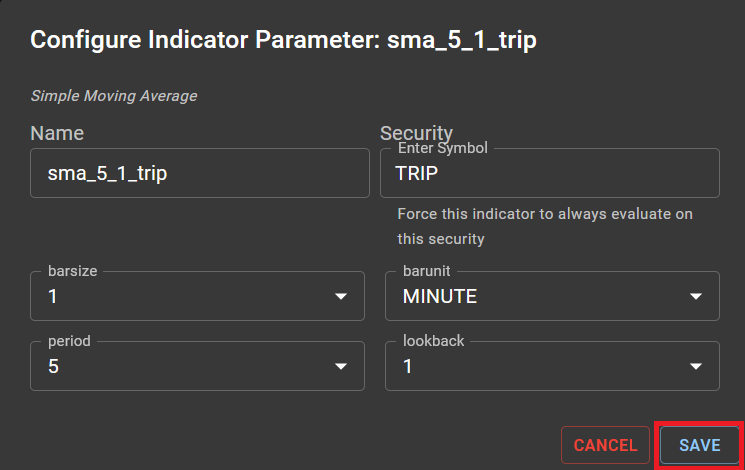
- Choose its interval and input series where offered.
- Enter required parameters such as period, smoothing, deviation, or session window.
- If the indicator has multiple outputs, choose the output you intend to display or compare.
- Read the generated label and verify the parameters before applying it.
Intervals, warm-up, and missing values
A period is counted in bars of the selected interval. A 20-period daily calculation and a 20-period minute calculation cover different time spans. Lookback-based indicators need enough prior bars before a value can be produced, and session indicators depend on market-session boundaries.
Do not assume a missing value is zero or a meaningful false signal. Check data availability, symbol history, interval, and parameters.
Worked rule example
Suppose you configure a daily rule that compares a 20-bar simple moving average with a 50-bar simple moving average. The rule is true only when the shorter average is above the longer average for the evaluated symbol and daily bar. The comparison describes a condition; it does not predict a gain or recommend a trade.
Confirm both indicators use the intended price series and interval, allow enough history for the 50-bar warm-up, and decide whether the workflow should inspect the current state or react only when it changes from false to true.
Edit or remove
Use the chart or expression control to edit parameters or remove an indicator. The same indicator can be configured differently in different places; editing a chart study does not change a strategy expression.
When the built-in catalog does not express the calculation you need, see Custom Indicators. For automation context, continue to building a trading bot from your own rules.