- Getting Started
- What is Investfly?
-
User Management
-
Market Analysis
-
Trading
-
Automated Strategies
-
Logical Expressions
- Custom Indicators
- Investfly SDK API Docs
Portfolio Dashboard
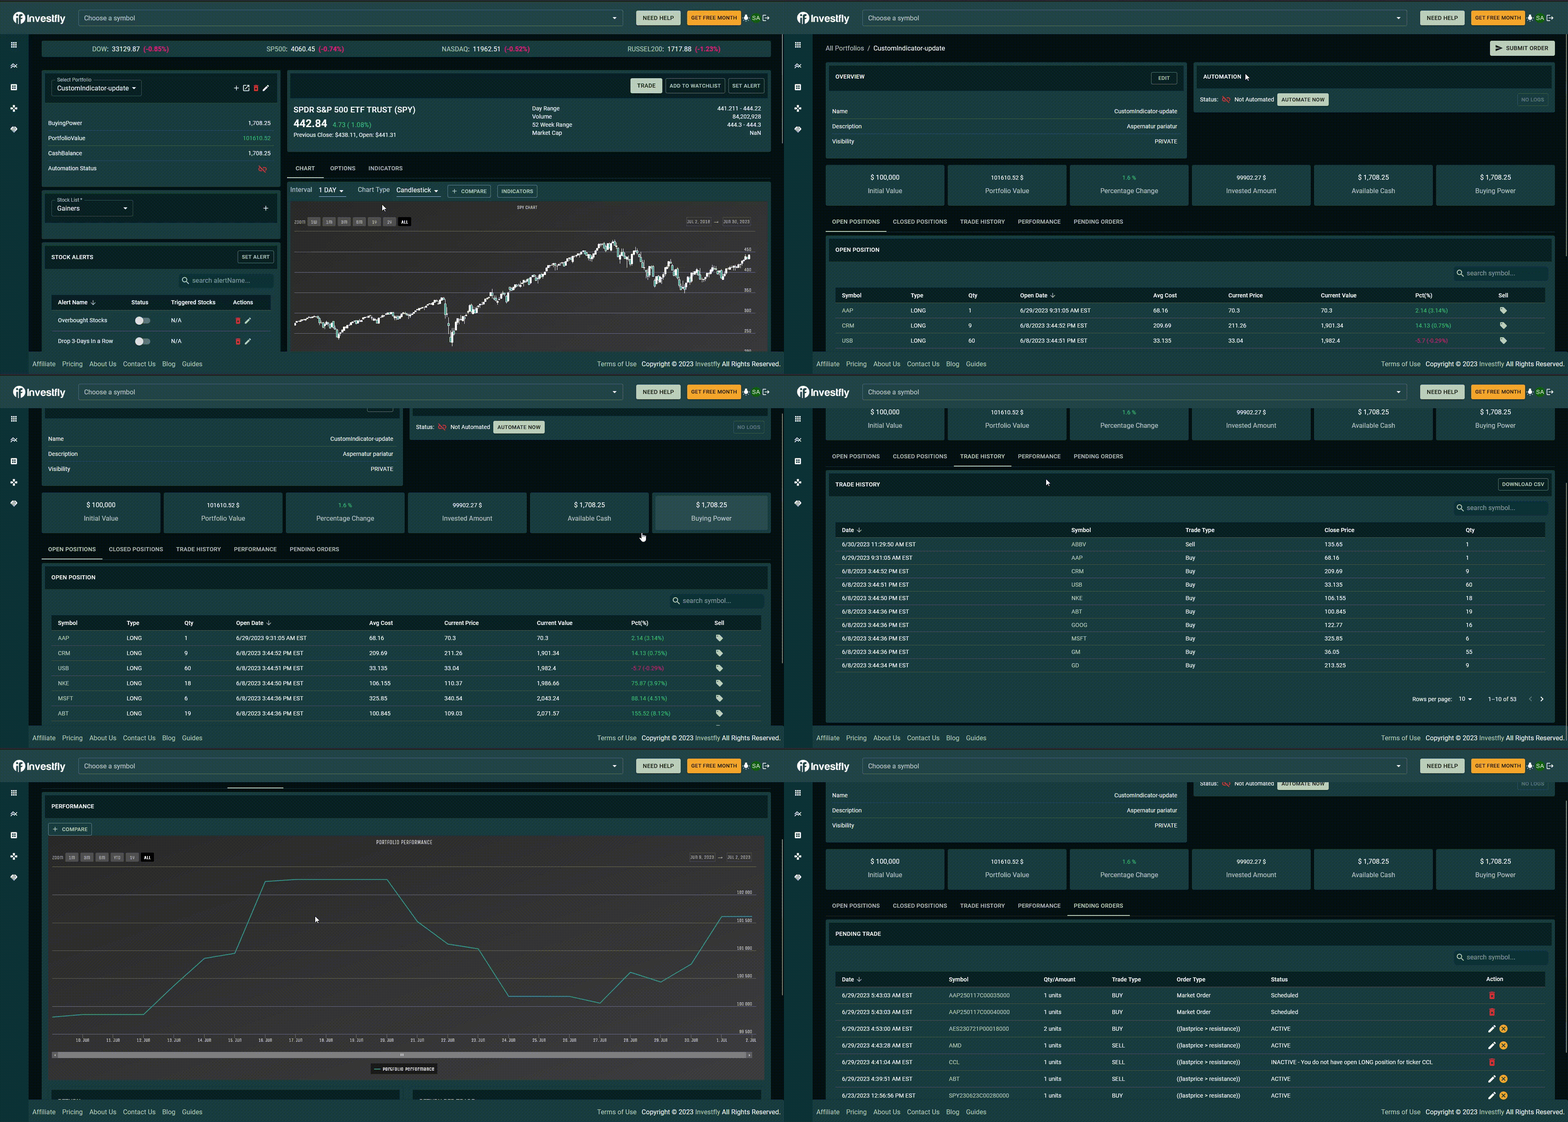
The portfolio dashboard shows everything about your portfolio in a single page. The exact same portfolio dashboard is shown for both virtual portfolio and real broker account.
Portfolio Controls
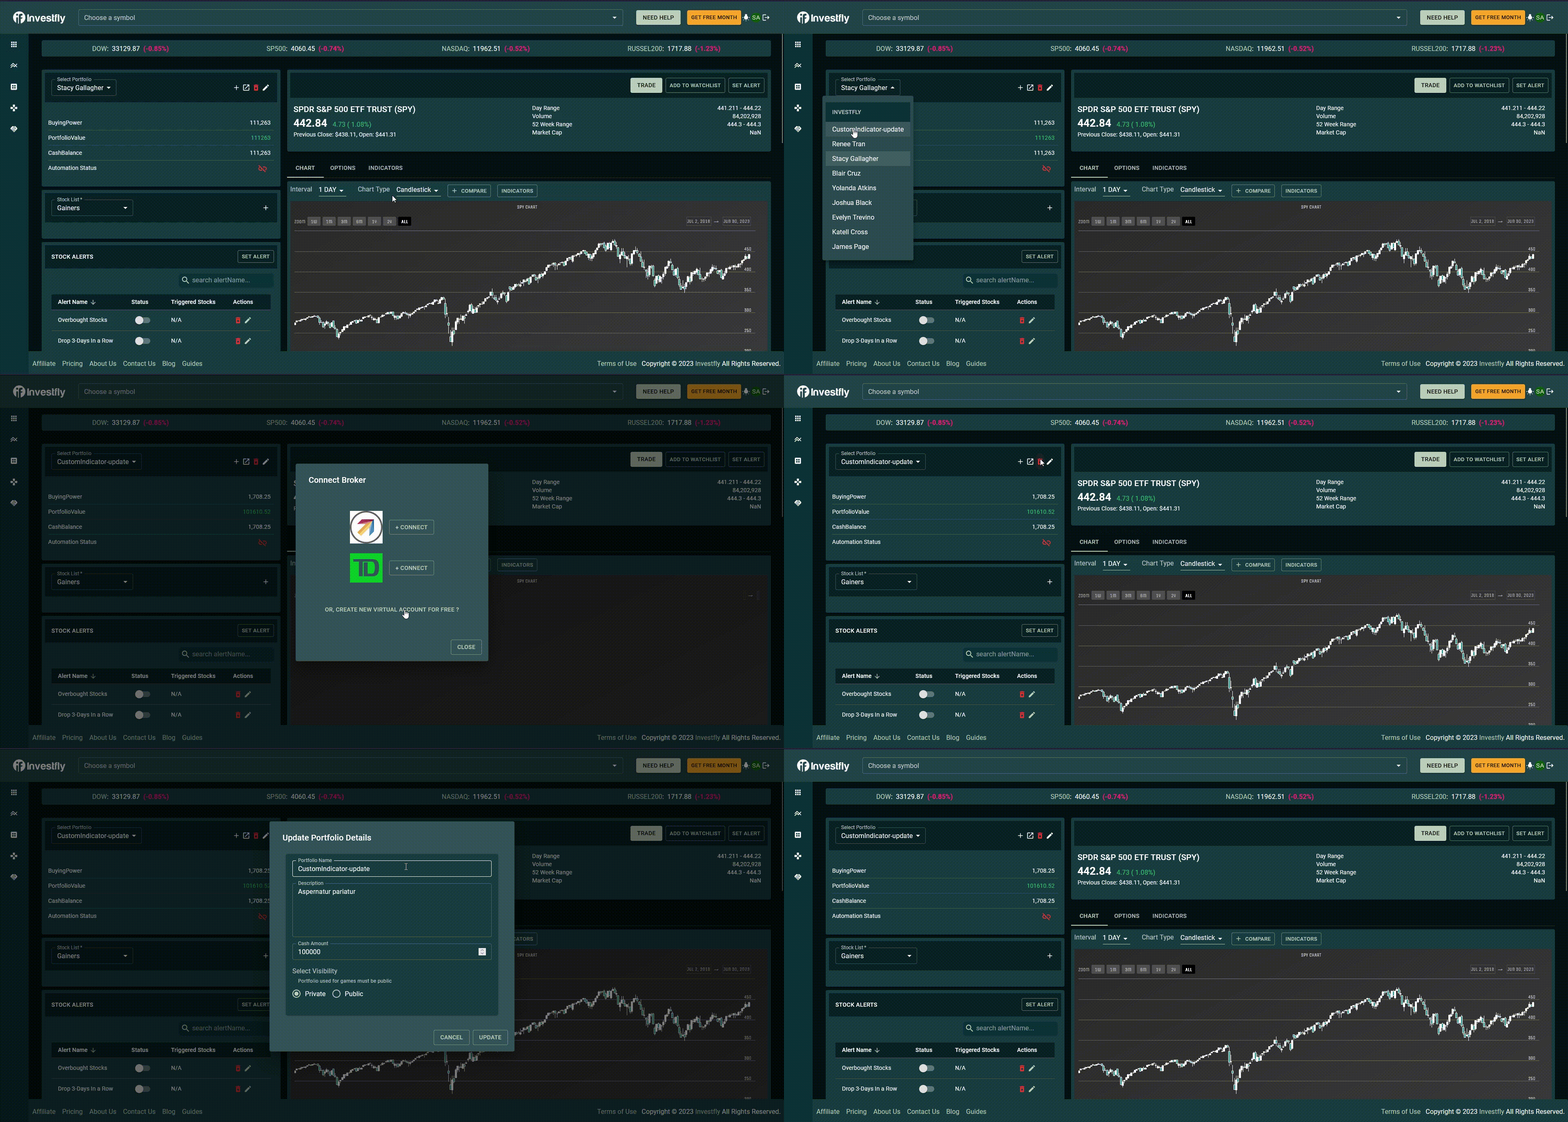
The top row provide portfolio controls to
- Add more virtual portfolio
- Connect a broker account
- Switch to a different portfolio
- Open Portfolio Dashboard page in new tab.
Automation Control
The second row display the automation status for your portfolio. If the portfolio is automated, it means that an automated trading strategy has been deployed on this portfolio. Read related pages on Automated Strategies for more details on how to define and deploy automated trading strategy. When the portfolio is automated, it will display the the name of the strategy that is deployed and a button to view automation logs. You can also deploy or undeploy a trading strategy to this portfolio from this section.
Automation Logs
Automation logs shows every action that the automated strategy performed on your portfolio. It gives you a deep insight on what is going on with your portfolio. Some examples of logs you could see are:
Portfolio balance
The next section shows portfolio value summary: initial value, current value, invested amount, cash balance, buying power, profit loss. They are updated in real time every 10 secs. Note that initial value and profit loss are only applicable and shown for virtual portfolio. In case of real broker account, starting account balance cannot be retrieved and its irrelevant because (unlike virtual portfolio) you can deposit and withdraw cash at any point in time. Without the starting cash balance, portfolio lifetime profit/loss cannot be computed. It would also not make sense unless we adjust for deposits and withdraws.

Open Positions and Pending Orders
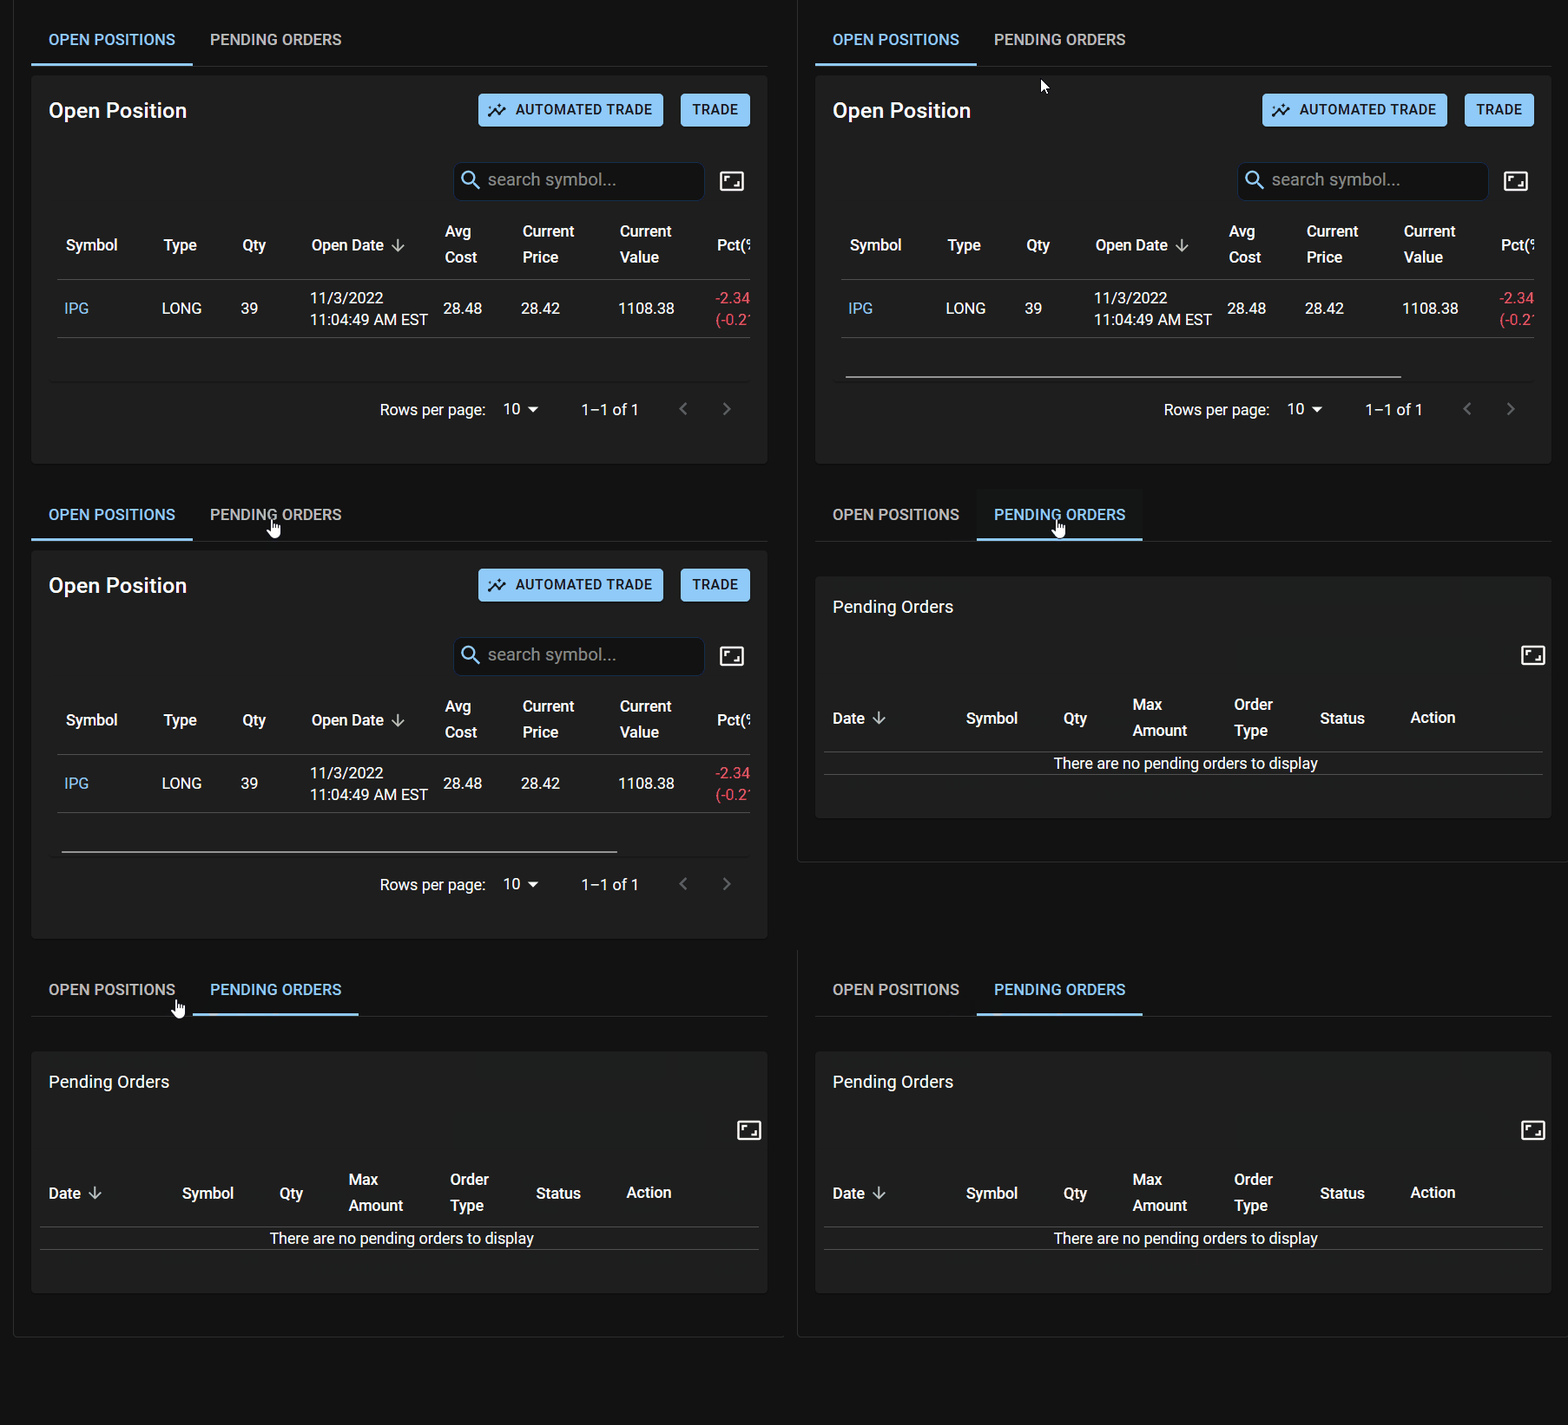
Open positions and pending orders are displayed as tabs on the left. When you submit a trade order, if it gets filled immediately, then the stock will appear immediately in the open positions table. If the order gets scheduled or if it's an automated trade order, then it will appear in the Pending orders tab. You can cancel any scheduled order from pending orders tab by clicking the delete icon next to the order you want to cancel.
Closed Positions and Trade History
Closed Positions and Trade History are grouped as tabs on the right. Trade history simply shows all your orders that were filled. Closed Positions BUY-SELL orders for the same stock in a single row so you can view your profit/loss for that position. All these can be downloaded to Excel for further analysis using the Download button.
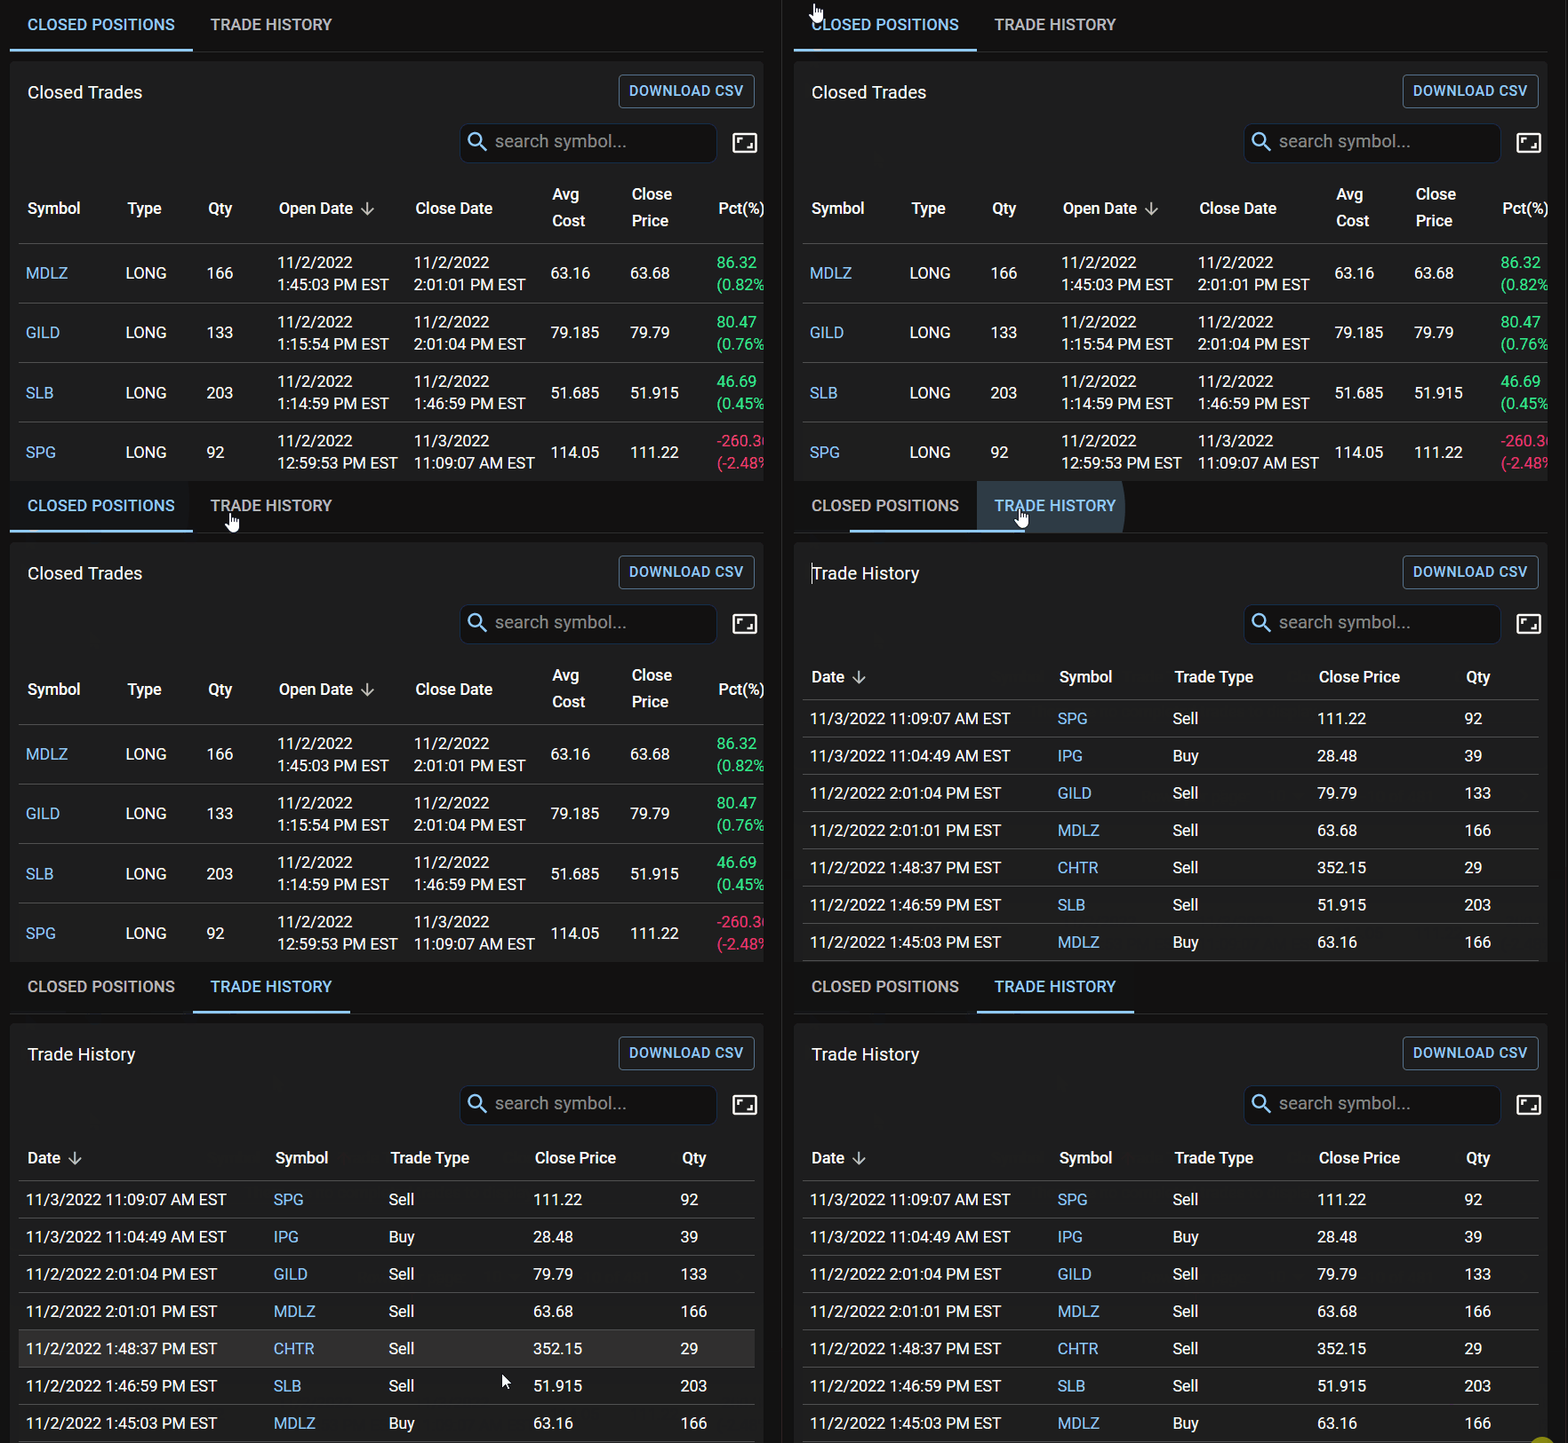
Closed Positions and Trade History
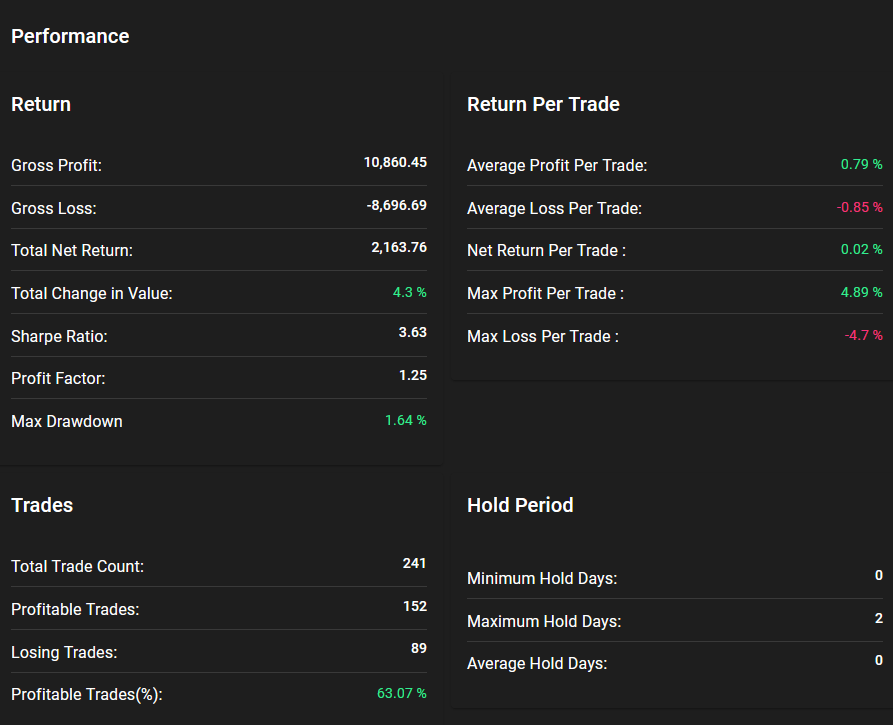
The bottom section shows portfolio performance metrics such as gross profit, loss, total return, profitable trades ( % ). It also shows equity value over time in a time-chart. Again, most of this is only applicable for virtual portfolio where we have complete data.
